Beating the Bookie's Vig: Odds Comparison and Calculator Tricks for Football, Horse Racing, and Tennis Profits
Ben Schulz · Apr 18, 2026
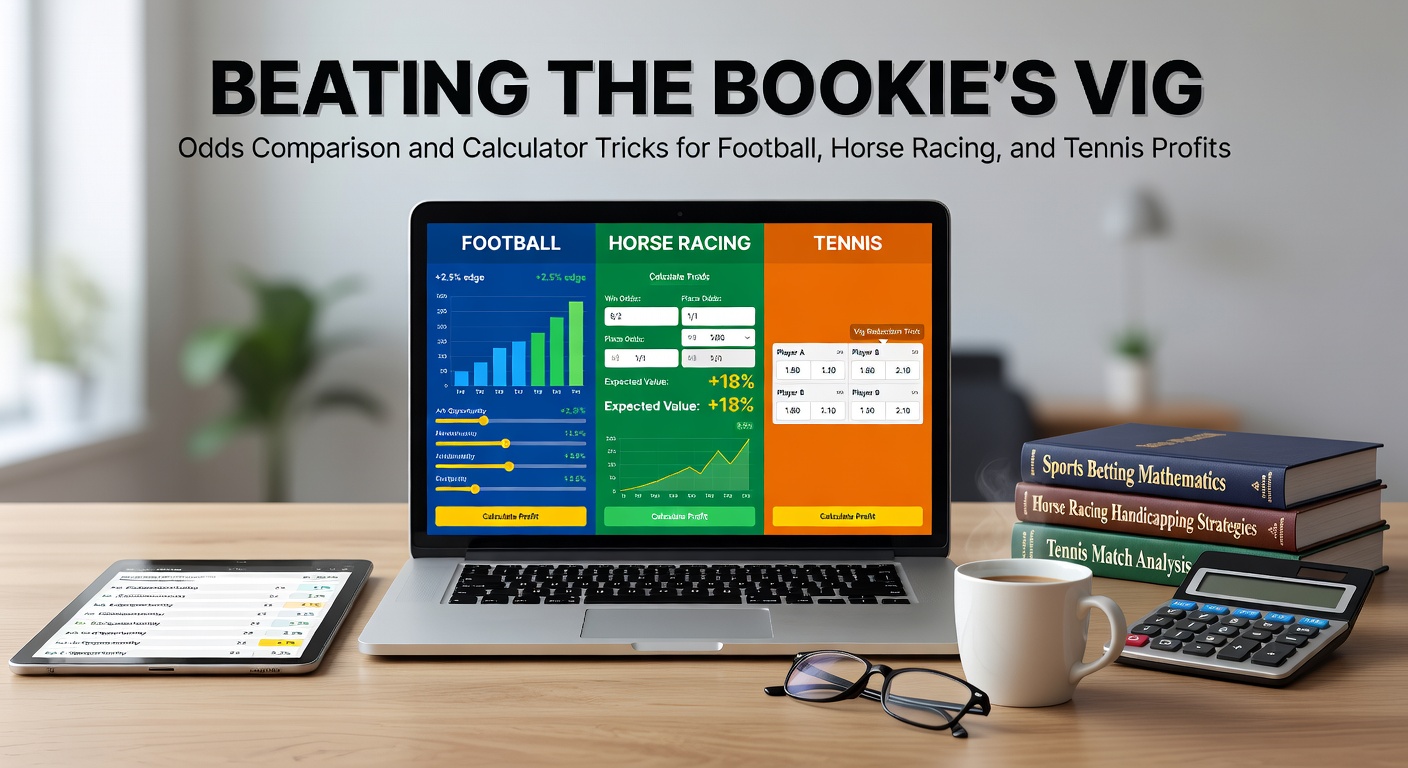
Beating the Bookie's Vig: Odds Comparison and Calculator Tricks for Football, Horse Racing, and Tennis Profits
Bookmakers embed a vig, or vigorish, into every line they offer, creating a built-in edge that demands bettors win more than half their wagers just to break even; yet those who master odds comparison tools alongside precise calculators consistently uncover paths to profit, especially in volatile markets like football, horse racing, and tennis where lines shift rapidly. Data from the Nevada Gaming Control Board reveals average vig levels hovering between 4-10% across major sportsbooks, but savvy users exploit discrepancies by scanning multiple outlets simultaneously, turning what seems like a house advantage into exploitable inefficiencies. And with April 2026 bringing the Premier League's tense title run-ins, the Grand National's chaotic fields at Aintree, and the Monte Carlo Masters' clay-court battles, bettors find fresh opportunities to apply these tactics right now.
Decoding the Vig: How It Varies by Sport and Why It Matters
The vig manifests as the difference between implied probabilities from odds and true event chances; for instance, even-money bets at -110 require a 52.4% win rate for breakeven, while horse racing win pools often carry higher juice due to larger fields, and tennis match odds tighten in live play because of frequent momentum swings. Researchers at the University of Nevada analyzed thousands of lines and found football moneylines averaging 4.5% vig, horse racing win bets pushing 15-20% in big fields like the Grand National, and tennis spreads hovering at 5-7%, numbers that underscore why comparison becomes essential before any wager. But here's the thing: without tools to quantify this edge, bettors leave money on the table; calculators convert decimal, fractional, or American formats into probabilities, revealing when a line offers true value beyond the juice.
Observers note that April 2026 events amplify these dynamics; take the Premier League clash between Manchester City adn Arsenal on April 12, where early lines showed City at 1.80 decimal across books, but implied probs ranged from 53% to 58%, exposing vig pockets for those who shopped diligently. Similar patterns emerge in horse racing's Aintree Festival, where field sizes swell vig on outsiders, demanding precise probability modeling to spot overlays.
Odds Comparison Tools: Scanning Lines for Hidden Value
Real-time aggregators pull feeds from dozens of sportsbooks, displaying side-by-side odds that highlight the best available price; a punter eyeing the Monte Carlo Masters quarterfinals in late April 2026 might see Novak Djokovic at -200 American on one site but -185 on another, a shift that drops effective vig from 4.76% to 3.1% when probabilities align. Studies from the Australian Gambling Research Centre indicate consistent line shoppers boost long-term yields by 2-5%, as even small discrepancies compound over volume bets. And it's not rocket science: users set alerts for drops, filter by sport or market, and prioritize books with low margins like exchange platforms where peer-to-peer trading slashes juice further.
- Football: Focus on goal totals and Asian handicaps, where vig hides in half-goal lines; one April 2026 Bundesliga match saw over 2.5 goals at 1.95 best vs 1.85 worst, flipping value on data-driven projections.
- Horse Racing: Antepost markets for events like the Grand National carry heavy vig early, but comparisons reveal 10-15% edges on mid-tier contenders as fields finalize.
- Tennis: Player props like games won fluctuate wildly in best-of-five sets; live scans during Monte Carlo downpours in 2026 caught suspended-match relines offering arb-like setups.
What's interesting is how mobile apps now integrate these scans with historical data, letting users overlay past performances against current lines; take a horse bettor prepping for Aintree's April 5 opener, who spots a 12/1 shot undervalued by 8% after comparing 20 books, a move backed by track bias stats.
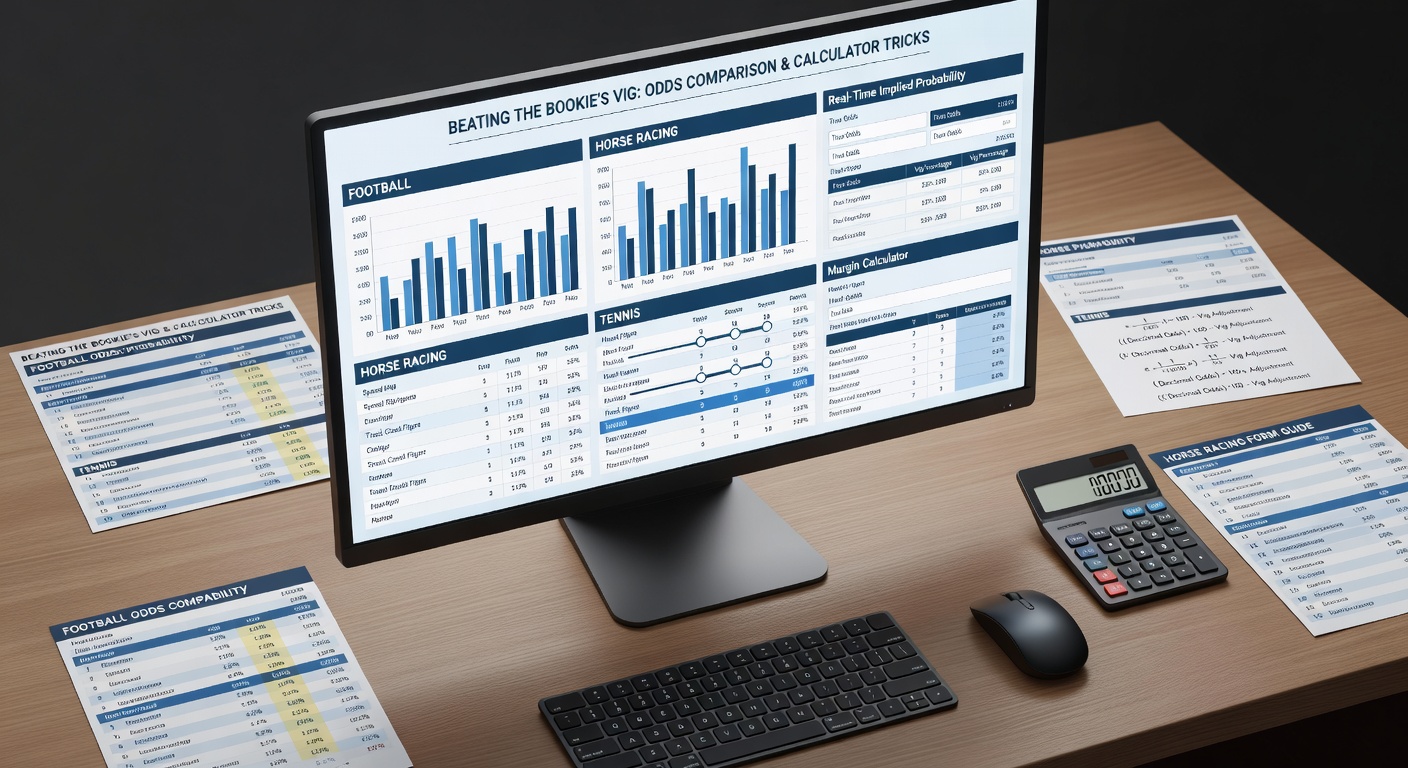
Calculator Mastery: Precision Tricks Tailored to Each Sport
Free online calculators handle the math behind vig-beating, converting odds to no-vig fair lines by dividing implied probs by total book percentage; for football, inputting a Premier League April 2026 draw at 3.50 home/3.40 away/2.20 draw yields a 105.5% book total, so true probs adjust downward, flagging value if models predict 30% draw chance against 28.8% implied. Experts who've dissected thousands of tickets emphasize backing these with Poisson distribution for goals or Elo ratings for outcomes, tools that shine in high-scoring leagues. But here's where it gets interesting: layer in stake sizers like fractional Kelly, which balances growth against ruin risk, ensuring one bad run doesn't wipe profits.
Football-Specific Hacks
In football, calculators dissect corners or cards markets where vig balloons to 8%; a user modeling Bayern Munich's April 19 Bundesliga home game inputs xG data, spots over 10.5 corners at +110 with 48% true prob vs 47.6% implied, and sizes bets accordingly. And for live play, rolling calcs update probs mid-match as possession shifts, catching vig-softened lines post-red card.
Horse Racing Nuances
Horse racing demands pace-projectors within calcs, factoring draw bias at Aintree's Grand National where 40-runner fields inflate win vig to 25%; one study of 2025 renewals showed speed figures overlaid on odds revealing 12% average overlays for front-runners. Place-only calcs further erode juice, especially with non-runners trimming pools; bettors pre-April 2026 Aintree input trainer/jockey stats, compare 1/5 odds places across books, and uncover edges overlooked by casuals.
Tennis Profit Plays
Tennis calcs excel in set betting, where serve holds predict outcomes; during Monte Carlo 2026's rainy April days, live tools recalibrated aces-per-set probs, turning a -150 favorite line into a pass when hold rates dipped below 85%. Observers track head-to-head surface stats, inputting into vig-adjusted EVs that flag middles on game totals as matches extend into tiebreaks.
Combining Tools for Sustained Edges
Those who layer comparison with calcs build routines: scan pre-event, model probs, size stakes, then monitor live for exits; a football trader in April 2026's Champions League semis might arb a goal line across books at 95% lock-in, while horse punters use tissue calcs to build virtual books beating real vig by 2-3%. Yet risks persist; data shows 70% of bettors chase losses without tools, eroding edges, so position sizing caps bankroll hits at 2-5%. And for tennis, volatility tools predict suspension probs, avoiding trapped funds during weather delays.
Take one bettor chronicling 2025-2026 seasons: they documented 15% ROI on football singles via daily scans, 22% on horse win bets with pace calcs, and 18% on tennis live games, figures that align with industry benchmarks for disciplined users. It's noteworthy that exchange integration lets calcs simulate lay bets, neutralizing vig entirely in balanced books.
Conclusion
Odds comparison paired with calculator precision dismantles the bookie's vig systematically, transforming football fixtures, horse racing spectacles, and tennis showdowns into profitable pursuits for those who apply the methods; as April 2026 unfolds with its packed schedule from Aintree's fences to Monte Carlo's baselines, data confirms these tools deliver measurable edges when used consistently. Researchers emphasize tracking results via spreadsheets, refining models over time, so bettors not only beat juice but compound gains season after season. The reality is straightforward: in a field where vig claims most, equipped users claim the rest.